Election years can bring added stress and uncertainty to many aspects of life, and this election cycle is certainly no exception. Elections are important, and their outcomes can affect the lives of millions, if not billions, around the globe. But how important are they for investors? Every cycle is different, and investors’ focus is always changing, but history suggests that the party in the White House is just one of many factors that move the S&P 500.
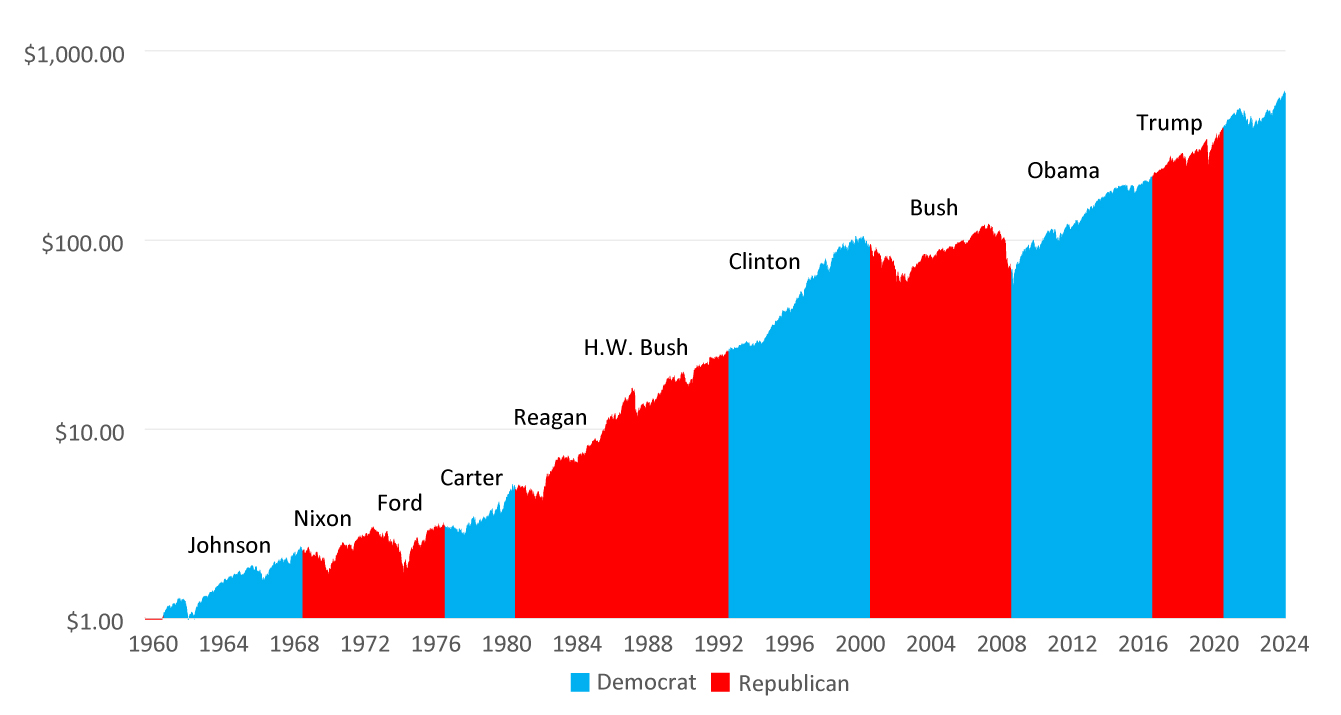
Looking back at the history of the S&P 500 (the “Index”), investors have had the opportunity to invest profitably under the watch of presidents from both parties. In fact, with the exception of George W. Bush, whose term unpredictably included both the unwinding of the Tech Bubble and the Great Financial Crisis, the Index has experienced a positive total return under every president in the last fifty years.
Figure 1: The Growth of $1 Invested in the S&P from 1960 –2024 (1)
Of course, national elections determine more than just the Presidency; Congress is a major driver of policy as well. Expanding the analysis to examine both the executive and the legislative branches of government shows that the market has done well under Democratic, Republican, and divided governments. Figure 2 illustrates Index returns when one party controlled both the Presidency and Congress as well as periods of split control (“divided government”).
Figure 2: S&P 500 Calendar Year Returns by Political Regime (2)
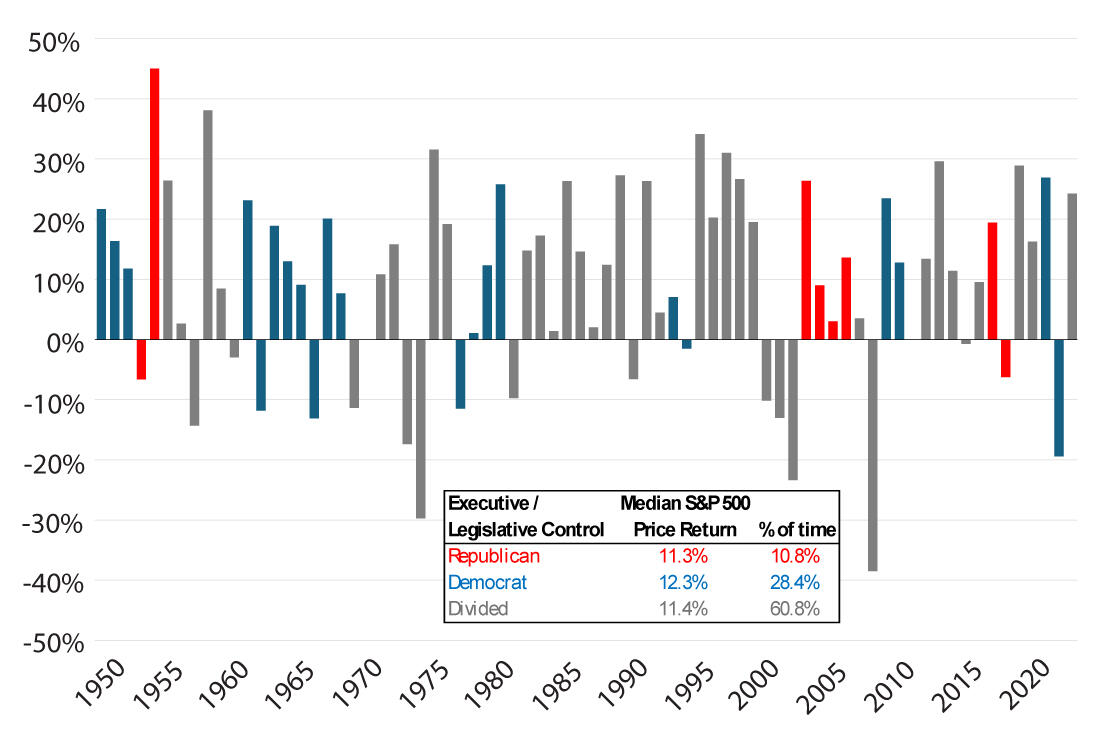
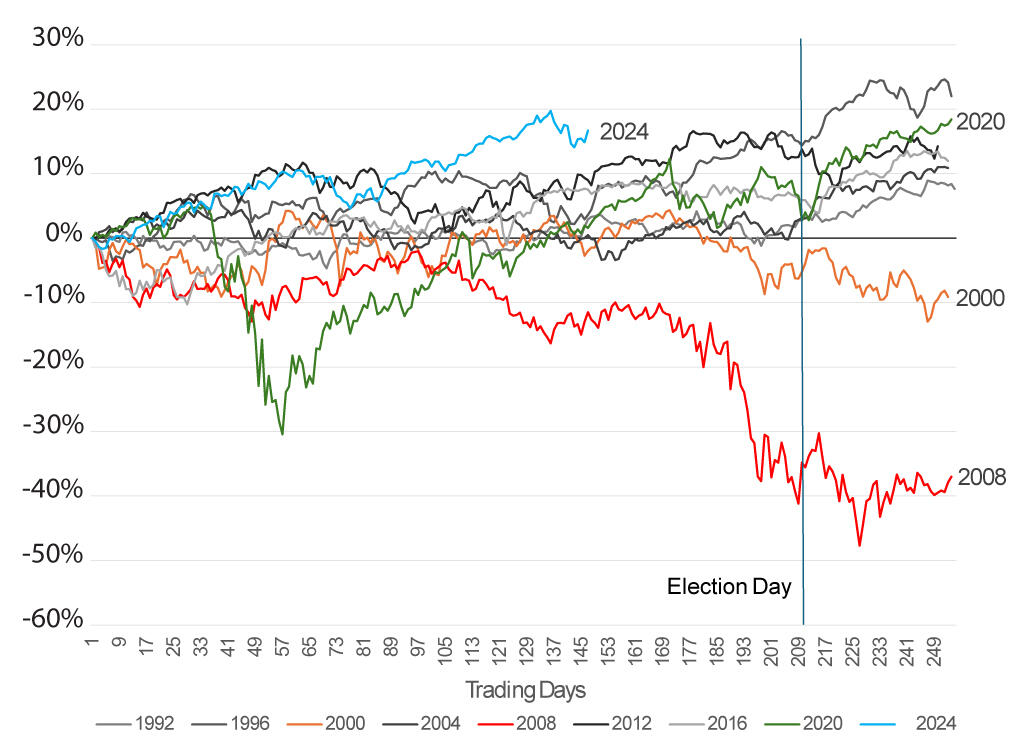
As Figure 2 indicates, over the long-term, investors can do well under either party’s leadership. But what about election years themselves? How does the increased uncertainty of changes in leadership affect the Index? We reviewed the last ten presidential election years, expecting to see increased volatility due to political uncertainty (Figure 3). What we saw instead was more evidence that the Index is driven by a mix of other economic factors beyond the election cycle. Only two of the last ten presidential election years saw the Index finish with a negative total return: 2008 (The Great Financial Crisis), and 2000 (The Tech Bubble). The only other year with a greater than average intra-year drawdown (more than 14%) was 2020, which saw a quick and significant decline during the height of the Covid pandemic, before ending the year in positive territory.
Figure 3: The S&P 500 over the last 10 Presidential Election Years (3)
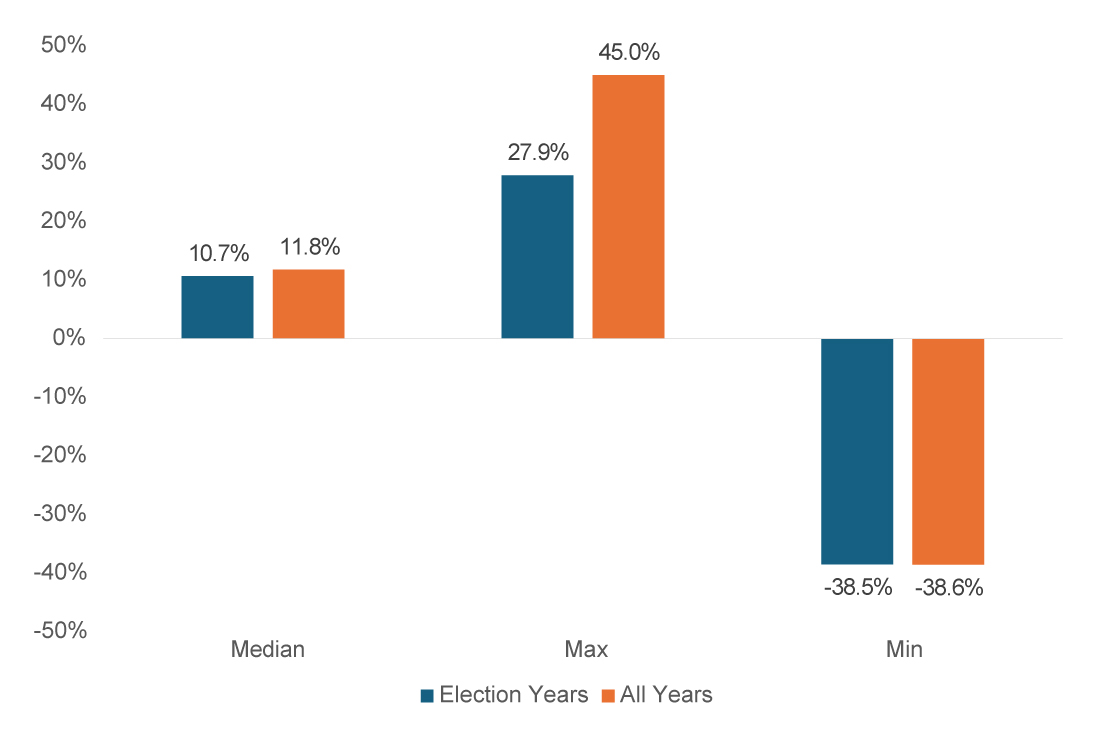
In fact, going all the way back to 1932, election years look remarkably similar to non-election years. The median Index return in election years has been 10.7% vs. 11.8% in all years. Maximum declines have also been similar. (Figure 4)
Figure 4: S&P 500 Price Returns in Election Years since 1932 (4)
Even knowing all of this, it can be hard for investors to divorce their feelings about the political environment from their views on the Index. To examine the potential impact of this, we looked at what would happen if an investor decided to be more cautious in years when their favored political party was not in the White House. For this exhibit, we took a typical 60% stock (S&P 500) and 40% bond (Bloomberg Intermediate Government/Credit Index) portfolio and compared it to one where an investor decided to underinvest in the S&P 500 by 5% (55% stock, 45% bond allocation), in years when their preferred party did not hold the presidency. We refer to this as the “Pessimistic Party Portfolio.” Given the history we’ve already discussed, it will be unsurprising to you that this strategy has not been a good one on average (Figure 5). Since 1974, the Pessimistic Party Portfolio has underperformed in every cycle except for George W. Bush, who we already mentioned, contended with two major economic events during his term (the Tech Bubble and the Great Financial Crisis).
Figure 5: Hypothetical Annualized Returns of Politically Driven Pessimism (5)

It is fortunate that the long-term driver of S&P 500 returns has been the earnings and profitability growth produced by American companies. Those companies have proven remarkably resilient and innovative over time – compounding wealth for investors in all manner of economic and political environments. The policies enacted by politicians impact business in meaningful ways, but time and again American businesses have risen to the challenge of adapting to the environment. History has shown us repeatedly that investors are better off leaving politics out of their portfolios, staying optimistic, and remaining focused on their long-term objectives. In the end, politicians are likely not as deserving of investors’ thanks or ire as they would like us to believe.
Published 08/29/2024
One of our most important responsibilities to client and prospective clients is to communicate in an open and direct manner. Some of our comments in this presentation are based on current management expectations and are considered “forward-looking statements”. Actual future results, however may prove to be different from our expectations. We cannot promise future results. Any performance expectations presented here should not be taken as any guarantee or other assurance as to future results. Our opinions are a reflection of our best judgment at the time this presentation was created, and we disclaim any obligation to update or alter forward-looking statements as a result of new information, future events or otherwise. The material contained herein is based upon proprietary information and is provided purely for reference and as such is confidential and intended solely for those to whom it was provided by JIC. This presentation makes use of information obtained from third-party vendors Johnson Investment Counsel (JIC) believes to be reliable but does not guarantee its accuracy.
JIC is an SEC registered investment adviser which does not imply a certain level of skill or training. Additional information regarding JIC’s business practices, conflicts of interest and registration status is available via the SEC’s Investment Adviser Public Disclosure website by clicking on the following link (www.adviserinfo.sec.gov) and typing either Johnson Investment Counsel, Inc. or the following CRD# 117054.
